
Introduction
Housing affordability in Basin is a major concern due to the lower wage incomes and housing price increases in the past few years. The lack of workforce housing is having a significant impact on employers’ ability to recruit workers to support business expansion. Real estate professionals also report that very few younger local families are able to purchase homes and must wait years for their income to increase to make a housing purchase feasible.
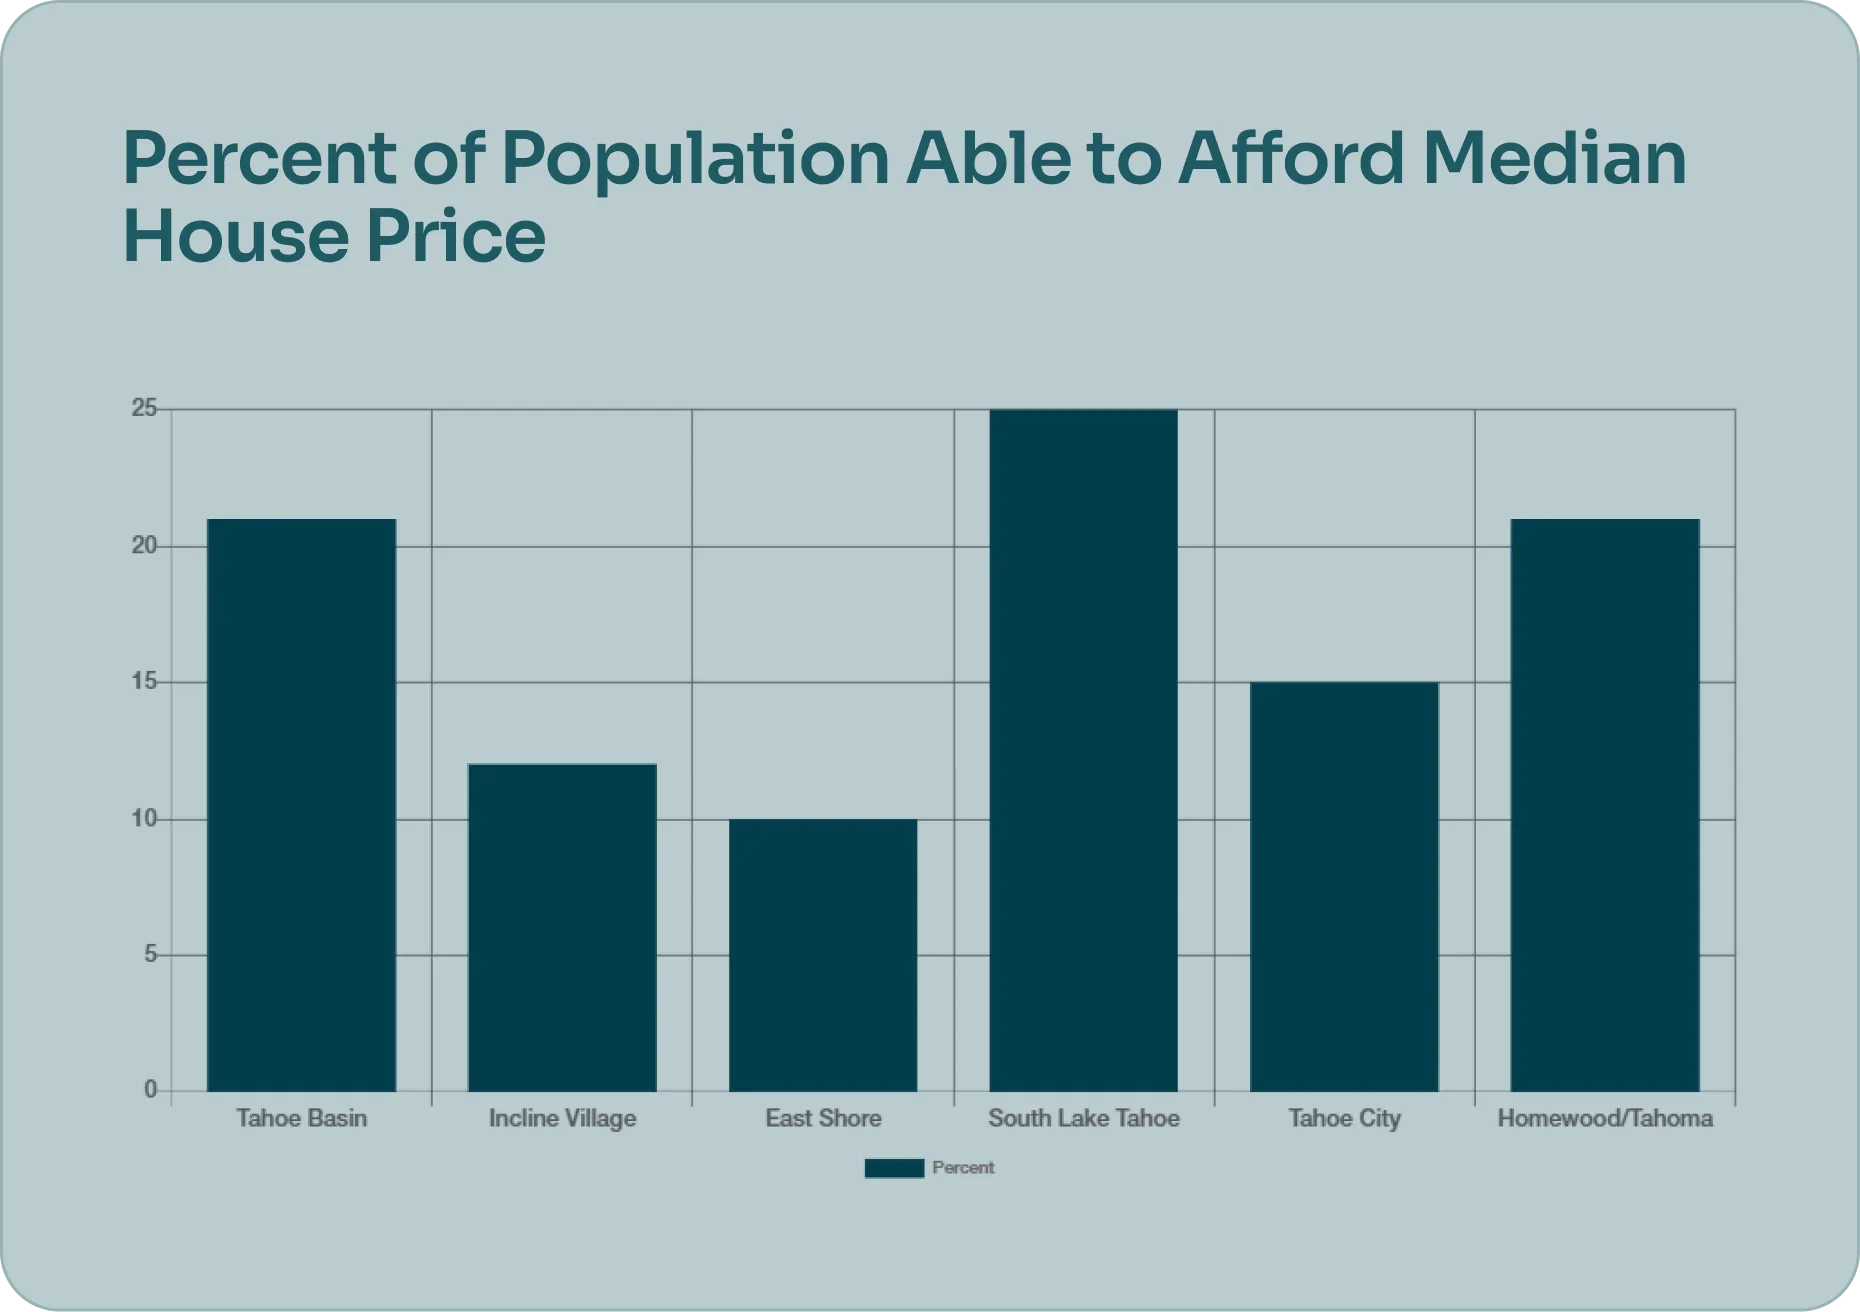
Housing affordability in Basin is a major concern due to the income and housing price statistics just described. The lack of workforce housing is having a significant impact on employers’ ability to recruit workers to support business expansion. Real estate professionals also report that very few younger local families are able to purchase homes and must wait years for their income to increase to make a housing purchase feasible. This chart provides an analysis of the proportion of households that could afford the median priced home in 2015 in several of the major markets within the region. The analysis reflects the standard policy threshold that housing costs should not exceed 30 percent of household income. The monthly housing costs reflect current mortgage terms for home purchase as well as allowances for taxes and insurance. A balanced housing market would mean that 50 percent of households could afford to buy a median priced home. However, as shown in the table, the proportion of households who can afford the median priced single family home in their area range from 25 percent in South Shore to 10 percent in the East Shore area. The Basin-wide average is 28 percent. The values for condos are closer to the desired ratio, ranging from 41 percent in Incline Village to 32 percent in the East Shore and Basin-wide, except in the Homewood/Tahoma area where some condos are priced very high.
Notes:
- Housing cost based on 30 yr mortgage at 3.5% APR, 10% down payment, plus 1.5% for taxes/insurance.Housing costs equal 30% of qualifying income.
- Income based on US Census ACS 5-Year 2011-2015 Sample Tables B19001 and B25095
- Source: ADE, Inc., based on data in Tables A-28-A29 and A- 26.2